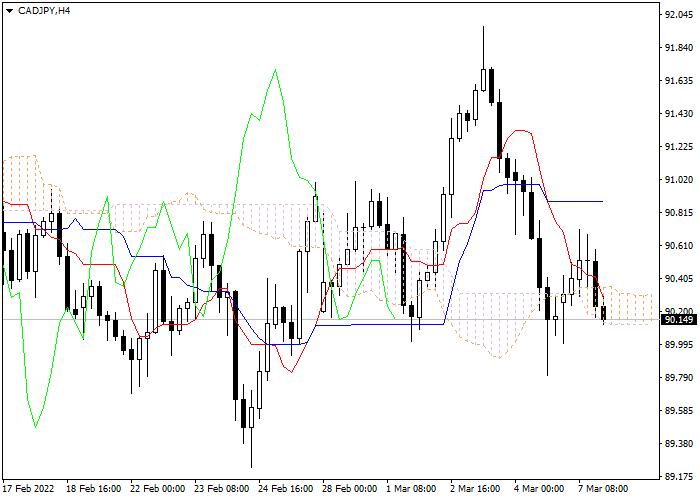
Let's look at the four-hour chart. Tenkan-sen line is below Kijun-sen, the red line is directed downwards, while the blue one remains horizontal. Confirmative line Chikou Span is below the price chart, current cloud is ascending. The instrument has entered the cloud. The closest support level is Tenkan-sen line (89.70). The closest resistance level is the lower border of the cloud (90.41).
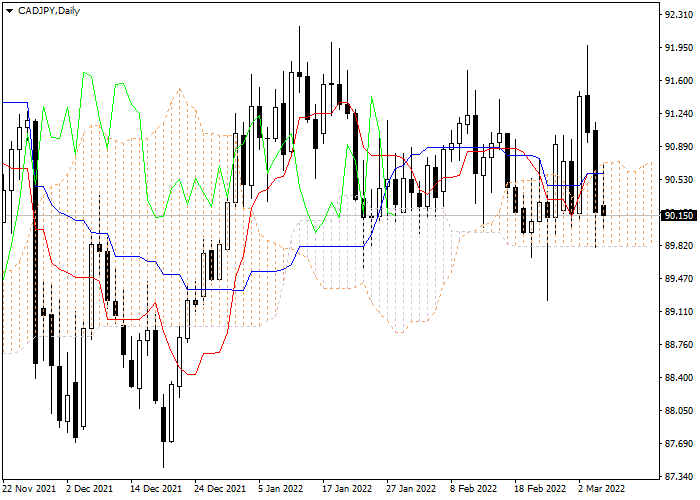
On the daily chart Tenkan-sen and Kijun-sen lines have merged, the lines are horizontal . Confirmative line Chikou Span is below the price chart, current cloud is ascending. The instrument has entered the cloud. The closest support level is the lower border of the cloud (89.68). The closest resistance level is the lower border of the cloud (90.69).
On the four-hour chart the instrument is trading within the cloud. On the daily chart the instrument is trading within the cloud. It is not recommended to open positions at current price. Pending orders should be placed at the cloud’s borders: sell at the level of 89.70, with Take Profit at 87.40 and Stop Loss at 90.41; buy at the level of 90.41, with Take Profit at 92.64 and Stop Loss at 89.70.
Canadian Dollar vs Japanese Yen
| Alış | Satış | Spread |
| 108.574 | 108.553 | 21 |
Scenario
| Time frame | Day's Range |
| Recommendations | SELL STOP |
| Entry Point | 89.70 |
| Take Profit | 87.40 |
| Stop Loss | 90.41 |
| Support levels | 89.68, 89.70, 90.41, 90.69 |
Alternative scenario
| Recommendations | BUY STOP |
| Entry Point | 90.41 |
| Take Profit | 92.64 |
| Stop Loss | 89.70 |
| Support levels | 89.68, 89.70, 90.41, 90.69 |
Bu sayfada yayınlanan içerikler, Claws&Horns Şirketi tarafından LiteFinance ile birlikte üretilmiştir ve 2014/65/AB Direktifi amaçları doğrultusunda yatırım tavsiyesi sağlanması olarak değerlendirilmemelidir; ayrıca, yatırım araştırmasının bağımsızlığını teşvik etmek için tasarlanmış yasal gerekliliklere uygun olarak hazırlanmamıştır ve bu tür araştırmaların yayımlanmasından önce işlem yapılmasına ilişkin herhangi bir yasağa tabi değildir.