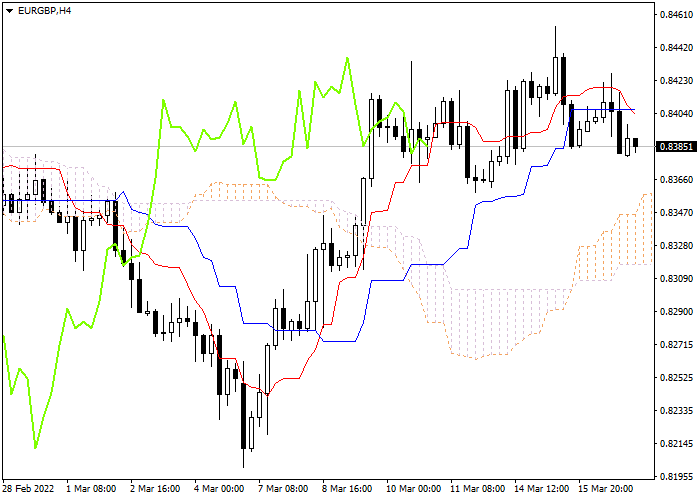
Let's look at the four-hour chart. Tenkan-sen line is below Kijun-sen, the red line is directed downwards, while the blue one remains horizontal. Confirmative line Chikou Span is crossing the price chart from above, current cloud is ascending. The instrument is trading below Tenkan-sen and Kijun-sen lines; the Bearish trend is still strong. One of the previous minimums of Chikou Span line is expected to be a support level (0.8343). The closest resistance level is the upper border of the cloud (0.8484).
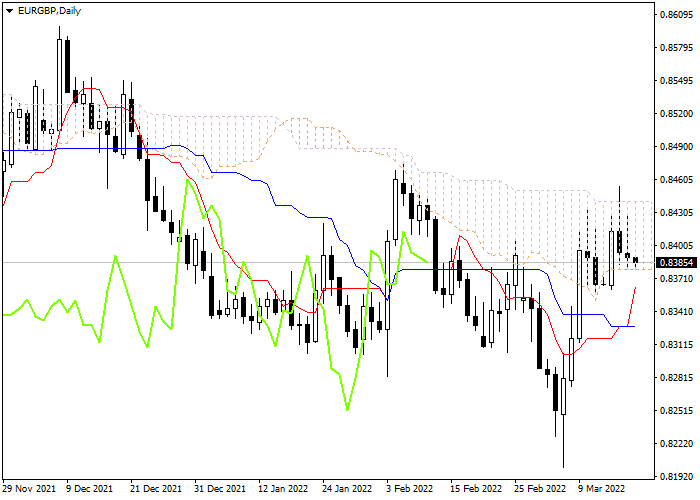
On the daily chart Tenkan-sen line is above Kijun-sen, the red line is directed upwards, while the blue one remains horizontal. Confirmative line Chikou Span is crossing the price chart from below, current cloud is descending. The instrument is trading around lower border of the cloud. One of the previous minimums of Chikou Span line is expected to be a support level (0.8195). The closest resistance level is the lower border of the cloud (0.8443).
On the four-hour chart the instrument is still rising. On the daily chart the instrument is trading within the cloud.
Euro vs British Pound
| Alış | Satış | Spread |
| 0.87452 | 0.87436 | 16 |
Scenario
| Time frame | Day's Range |
| Recommendations | BUY |
| Entry Point | 0.8385 |
| Take Profit | 0.8484 |
| Stop Loss | 0.8343 |
| Support levels | 0.8195, 0.8343, 0.8443, 0.8484 |
Alternative scenario
| Recommendations | |
| Entry Point | |
| Take Profit | |
| Stop Loss | |
| Support levels |
Bu sayfada yayınlanan içerikler, Claws&Horns Şirketi tarafından LiteFinance ile birlikte üretilmiştir ve 2014/65/AB Direktifi amaçları doğrultusunda yatırım tavsiyesi sağlanması olarak değerlendirilmemelidir; ayrıca, yatırım araştırmasının bağımsızlığını teşvik etmek için tasarlanmış yasal gerekliliklere uygun olarak hazırlanmamıştır ve bu tür araştırmaların yayımlanmasından önce işlem yapılmasına ilişkin herhangi bir yasağa tabi değildir.