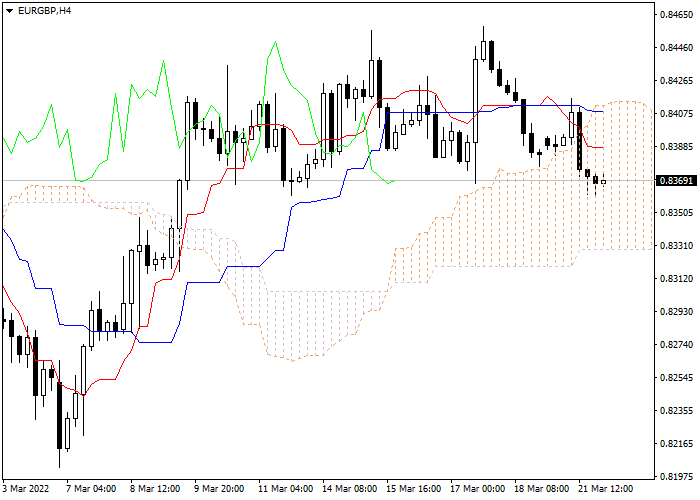
Let's look at the four-hour chart. Tenkan-sen line is below Kijun-sen, the lines are horizontal . Confirmative line Chikou Span is below the price chart, current cloud is descending. The instrument has entered the cloud. The closest support level is Tenkan-sen line (0.8330). The closest resistance level is Tenkan-sen line (0.8404).
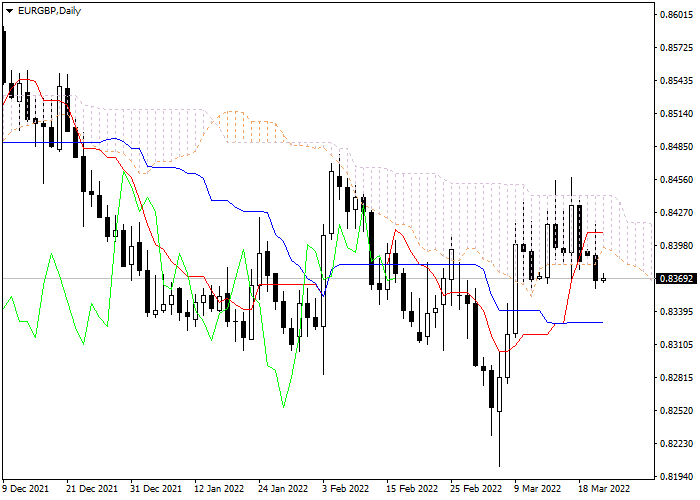
On the daily chart Tenkan-sen line is above Kijun-sen, the lines are horizontal . Confirmative line Chikou Span is crossing the price chart from above, current cloud is descending. The instrument is trading between Tenkan-sen and Kijun-sen lines. The closest support level is Kijun-sen line (0.8338). The closest resistance level is Tenkan-sen line (0.8407).
On the four-hour chart the instrument is trading within the cloud. On the daily chart the Bearish trend is still strong. It is not recommended to open positions at current price. Pending orders should be placed at the cloud’s borders: sell at the level of 0.8330, with Take Profit at 0.8115 and Stop Loss at 0.8414; buy at the level of 0.8414, with Take Profit at 0.8640 and Stop Loss at 0.8330.
Euro vs British Pound
| Alış | Satış | Spread |
| 0.87452 | 0.87436 | 16 |
Scenario
| Time frame | Day's Range |
| Recommendations | SELL STOP |
| Entry Point | 0.8330 |
| Take Profit | 0.8115 |
| Stop Loss | 0.8414 |
| Support levels | 0.8330, 0.8338, 0.8404, 0.8407 |
Alternative scenario
| Recommendations | BUY STOP |
| Entry Point | 0.8414 |
| Take Profit | 0.8640 |
| Stop Loss | 0.8330 |
| Support levels | 0.8330, 0.8338, 0.8404, 0.8407 |
Bu sayfada yayınlanan içerikler, Claws&Horns Şirketi tarafından LiteFinance ile birlikte üretilmiştir ve 2014/65/AB Direktifi amaçları doğrultusunda yatırım tavsiyesi sağlanması olarak değerlendirilmemelidir; ayrıca, yatırım araştırmasının bağımsızlığını teşvik etmek için tasarlanmış yasal gerekliliklere uygun olarak hazırlanmamıştır ve bu tür araştırmaların yayımlanmasından önce işlem yapılmasına ilişkin herhangi bir yasağa tabi değildir.